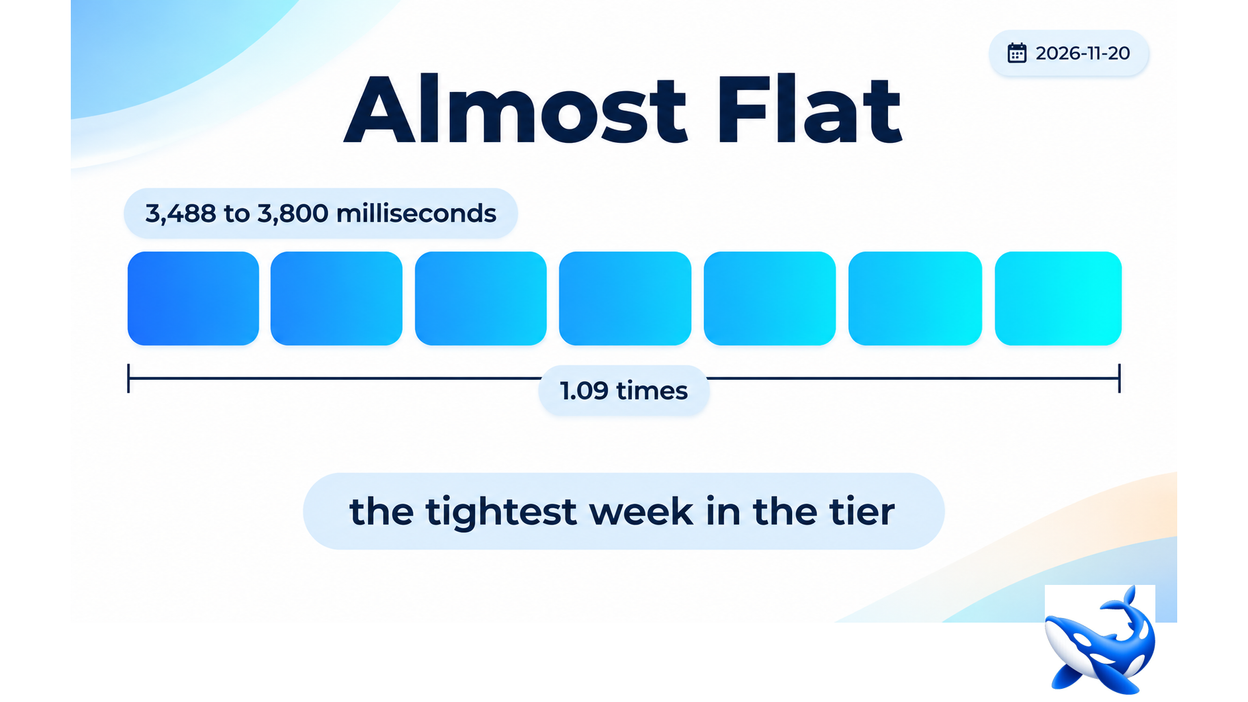
Three hundred twelve milliseconds is the entire range this card’s daily median covered in a week, and that makes it the most predictable card in the tier. OrcaRouter publishes the seven figures. They sit on OrcaCyber Hy4 latency, and they are unusual not because any one value is good but because they barely move.
The seven days
| date | p50 ms | p95 ms |
| 2026-11-14 | 3,758 | 10,000 |
| 2026-11-15 | 3,504 | 4,982 |
| 2026-11-16 | 3,676 | 10,000 |
| 2026-11-17 | 3,557 | 8,251 |
| 2026-11-18 | 3,742 | 9,313 |
| 2026-11-19 | 3,800 | 10,000 |
| 2026-11-20 | 3,488 | 8,910 |
Six of seven daily medians fall between 3,488 and 3,800 — a 9% range across a week. Nothing in the tier comes close.
| card | spread | range (ms) |
| Hy4 | 1.09× | 312 |
| MiniMax M3.1 Flash | 1.20× | 325 |
| Hy4 Flash | 1.33× | 970 |
| GLM 5.3 Flash | 1.34× | 1,324 |
| GLM 5.3 | 1.41× | 1,309 |
| Flash 1.0 | 1.57× | 448 |
| K3.1 Pro | 1.83× | 724 |
| Zero 1.5 | 2.26× | 1,210 |
| MiMo V2.6 Flash | 2.53× | 5,757 |
| Zero 1.0 | 3.08× | 2,564 |
| Ultra 1.0 | 3.37× | 3,633 |
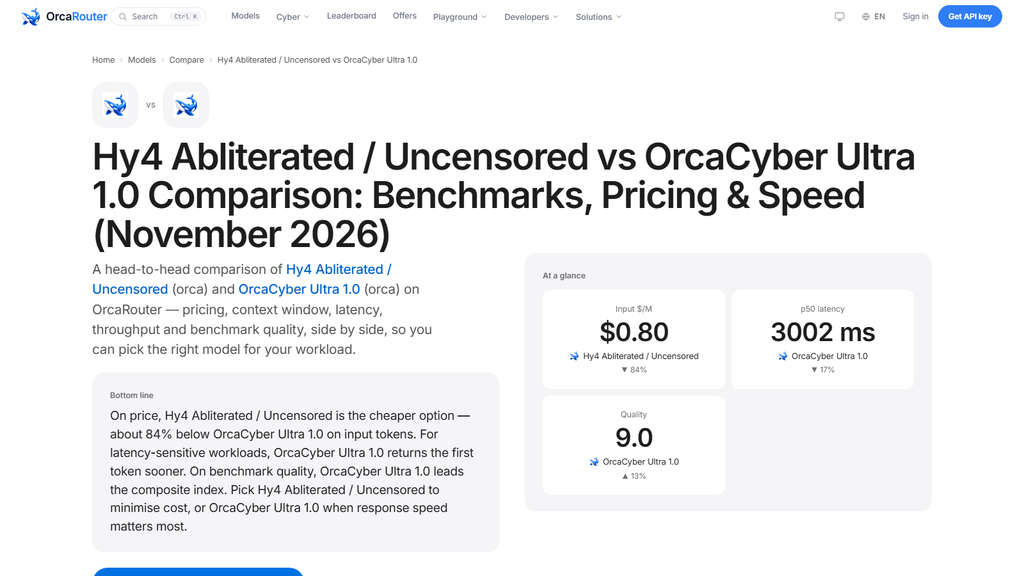
The range column is absolute rather than relative, and it changes the ranking. Flash 1.0’s 1.57× looks looser than GLM 5.3 Flash’s 1.34×, but Flash 1.0’s absolute range is 448 ms against 1,324 — it is a faster card with a smaller absolute drift.
Both readings are legitimate. A percentage answers “how much did it move relative to itself”; an absolute figure answers “how much did the wait change”. For timeout tuning the absolute figure is the one that matters, and by that measure this card and two others are the stable set.
A stable median over an unstable tail
Four of the seven days carry a readable p95 between 4,982 and 9,313; three hit the cap.
So the median is the tightest in the tier and the tail is unmeasured on 43% of days. The two facts are independent and both are published.
| date | p50 | p95 | tail readable? |
| 11-14 | 3,758 | 10,000 | no |
| 11-15 | 3,504 | 4,982 | yes |
| 11-16 | 3,676 | 10,000 | no |
| 11-17 | 3,557 | 8,251 | yes |
| 11-18 | 3,742 | 9,313 | yes |
| 11-19 | 3,800 | 10,000 | no |
| 11-20 | 3,488 | 8,910 | yes |
The readable tails span 4,982 to 9,313 — a factor of 1.87 — while the medians in the same four rows span 3,488 to 3,742, a factor of 1.07.
So within the days where the tail is measurable, the tail moves seventeen times as much as the median, proportionally. A buyer who tuned a timeout to the median would be tuning to the most stable quantity on the card and ignoring the least stable one.
The 15th is the outlier in a useful way: the median was 3,504 and the p95 was 4,982, a ratio of 1.42. On the 18th the ratio was 2.49. Same card, seven days apart.
What the card does at 135 tokens a second
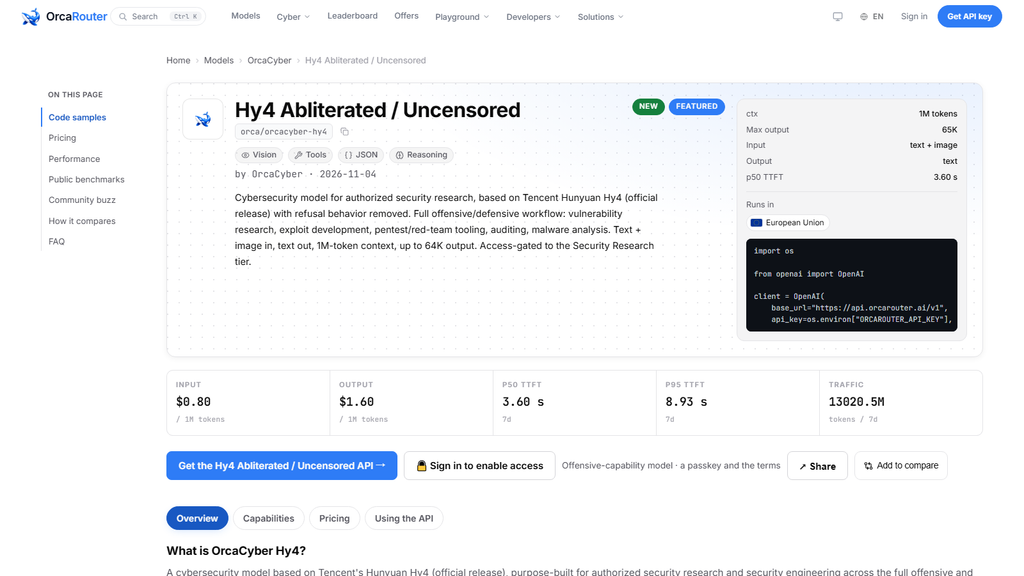
The throughput is 135.1 output tokens a second, fifth of twelve, and the ceiling is 65,536 — the smallest in the tier.
| card | ceiling | tok/s | fill |
| Hy4 | 65,536 | 135.1 | 8.1 min |
| Hy4 Flash | 65,536 | 182.1 | 6.0 min |
| Zero 1.0 | 128,000 | 240.2 | 8.9 min |
| Zero 1.5 | 128,000 | 195.6 | 10.9 min |
| MiniMax M3.1 Flash | 131,072 | 110.3 | 19.8 min |
| Ultra 1.0 | 131,072 | 109.2 | 20.0 min |
| GLM 5.3 | 128,000 | 91.6 | 23.3 min |
| Qwen3.8 Flash Next | 131,072 | 91.0 | 24.0 min |
| Flash 1.0 | 393,216 | 210.9 | 31.1 min |
| GLM 5.3 Flash | 131,072 | 66.4 | 32.9 min |
| MiMo V2.6 Flash | 131,072 | 51.7 | 51.7 min |
| K3.1 Pro | 943,718 | 81.4 | 193.2 min |
The 65,536-token ceiling is 6.25% of the card’s 1,048,576-token window — the lowest ratio in the tier alongside its Flash sibling. It is a card built for long input and short output.
Eight minutes to fill a ceiling is a short run by the tier’s standards, and it follows from a small ceiling rather than a fast rate. The card generates at about half Flash 1.0’s speed but writes a sixth as much per pass.
For a pipeline this is a benign combination: a call that finishes in under ten minutes fits inside most queue timeouts and most streaming readers without reconnection logic.
The traffic behind the stability
Twelve point seven nine billion tokens is the third-largest volume in the tier, at 11.1% of its traffic and 4.9% of its bill.
| quantity | value |
| 7-day tokens | 12.79 B |
| 7-day bill | $12,787 |
| blend | $1.0000 |
| error rate | 0.10 % |
| failed tokens | 13.2 M |
| failed cost per billion | $1,031 |
| $/M/s | $0.01184 |
A large volume on a stable median is what a card looks like when it is doing steady background work rather than serving interactive traffic. Interactive traffic arrives in bursts and produces medians that move; a queue drains at a constant rate.
The 0.10% error rate is the second-lowest in the tier and produces 13.2 million failed tokens — small in absolute terms for a card serving 12.79 billion.
Whether the stability is a property of the card or of its workload cannot be determined from the published fields. Both explanations fit, and the distinction matters: a card whose median is stable because it is used uniformly would be less stable under bursty traffic. That is a hypothesis, not a finding.
What a stable median is not
A 1.09× spread is a real property and it is easy to over-read, so it is worth naming what the field does not say.
| what it measures | what it does not |
| day-to-day movement of the daily median | per-request variability |
| seven consecutive days | any other week |
| first-token latency | generation speed |
| the median | the tail, which is capped on 3 days |
The first two rows are the important ones. A tight median says the days resembled each other; it says nothing about the spread of individual requests within a day, because the published series carries one number per day.
So a card can have an identical median every day and still have a wide per-request distribution. The daily series cannot distinguish that from a genuinely uniform card.
The third and fourth rows are the ones a buyer is most likely to conflate. A stable first-token figure does not imply stable generation — throughput is published as a single weekly number with no daily series at all.
Read with those limits, the 1.09× is still the strongest published statement about this card’s predictability, and it is stronger than any claim built on a single aggregate. It is just narrower than “the most predictable card in the tier” would suggest.
One further comparison puts the 312-millisecond range in perspective. Against a weekly median of 3,599 milliseconds, that range is 8.7% of the figure it varies around. On Ultra 1.0 the same calculation gives 122%, and on Zero 1.0 it gives 136%. So the tier spans two orders of magnitude in how much a card’s own week moves relative to its own level.
OrcaCyber Hy4’s seven daily medians spanned 312 milliseconds — 1.09×, the tightest week in the tier and less than half the next-tightest in absolute terms after Flash 1.0.
Its tail is a different story: three of seven days hit the 10,000 ms cap, and within the four readable days the p95 moved 1.87× while the median moved 1.07×. A 65,536-token ceiling at 135.1 tokens a second fills in 8.1 minutes, and its 0.10% error rate gives $1,031 of failure per billion tokens.
Sourcing note: the seven-day daily p50 and p95 series, weekly percentiles, throughput, error rate, price rows, ceiling, window, input modalities, quality score and token volume are read from the OrcaCyber Hy4 model API and card page on orcarouter.ai on 2026-11-20, with latency, throughput and error rates being OrcaRouter production telemetry for 2026-11-14 to 2026-11-20. The spreads, ranges, fill times and failure arithmetic are our own. A p95 reading of exactly 10,000 ms is the reporting cap, not a measurement; the explanation offered for the stable median is a hypothesis and is labelled as such. OrcaCyber Hy4 is published as an abliterated model. No competitor product is named or compared. Checked 2026-11-20.

I am Ethan Miles, a digital creator and caption enthusiast who loves turning simple moments into powerful words. I specialize in crafting creative, trendy, and engaging captions that help your posts stand out. At Captionestry, I focus on delivering fresh ideas, relatable expressions, and scroll-stopping content for every mood and moment. I’m passionate about social media culture, photography, and the art of storytelling through short, impactful lines.